This article is dedicated to electric vehicle (EV) sales charts updated at least once a month. Many of the charts are interactive and often don’t display well on smartphones — best to view this page on a laptop or desktop computer.
The charts included below (in this order) are:
- Plugin vehicle (PEV) market share versus 100% battery-electric vehicle (BEV) market share in 7 top countries in 2020 (interactive bar chart).
- Long-term plugin vehicle (PEV) market share trend in 7 top countries (interactive line graph).
- Long-term plugin vehicle (PEV) market share trend in 6 top countries (interactive line graph) — removed Norway in order to examine the other country trends better.
- Long-term plugin vehicle (PEV) market share trend in 7 top countries (interactive bar chart).
- Long-term plugin vehicle (PEV) market share trend in 6 top countries (interactive bar chart) — removed Norway in order to examine the other country trends better.
- Fully electric vehicle market share in 7 top countries in 2020, February 2021, and January–February 2021 (interactive bar chart).
- Plugin vehicle market share in 7 top countries in 2020, February 2021, and January–February 2021 (interactive bar chart).
- Plugin vehicle market share in 7 top countries in 2020, February 2021, and January–February 2021 (interactive bar chart).
- Fully electric vehicle market share in 6 top countries in 2020, February 2021, and January–February 2021 (interactive bar chart).
- Plugin vehicle market share in 6 top countries in 2020, February 2021, and January–February 2021 (interactive bar chart).
- Plugin vehicle market share in 6 top countries in 2020, February 2021, and January–February 2021 (interactive bar chart).
- Tesla quarterly sales by model from 2016–2020, with 3 & Y combined and S & X combined (interactive line graph).
- Tesla quarterly sales by model from 2016–2020, with model-specific numbers being CleanTechnica estimates because the figures in #6 are all that Tesla shares (interactive line graph).
- Tesla quarterly deliveries (interactive bar graph).
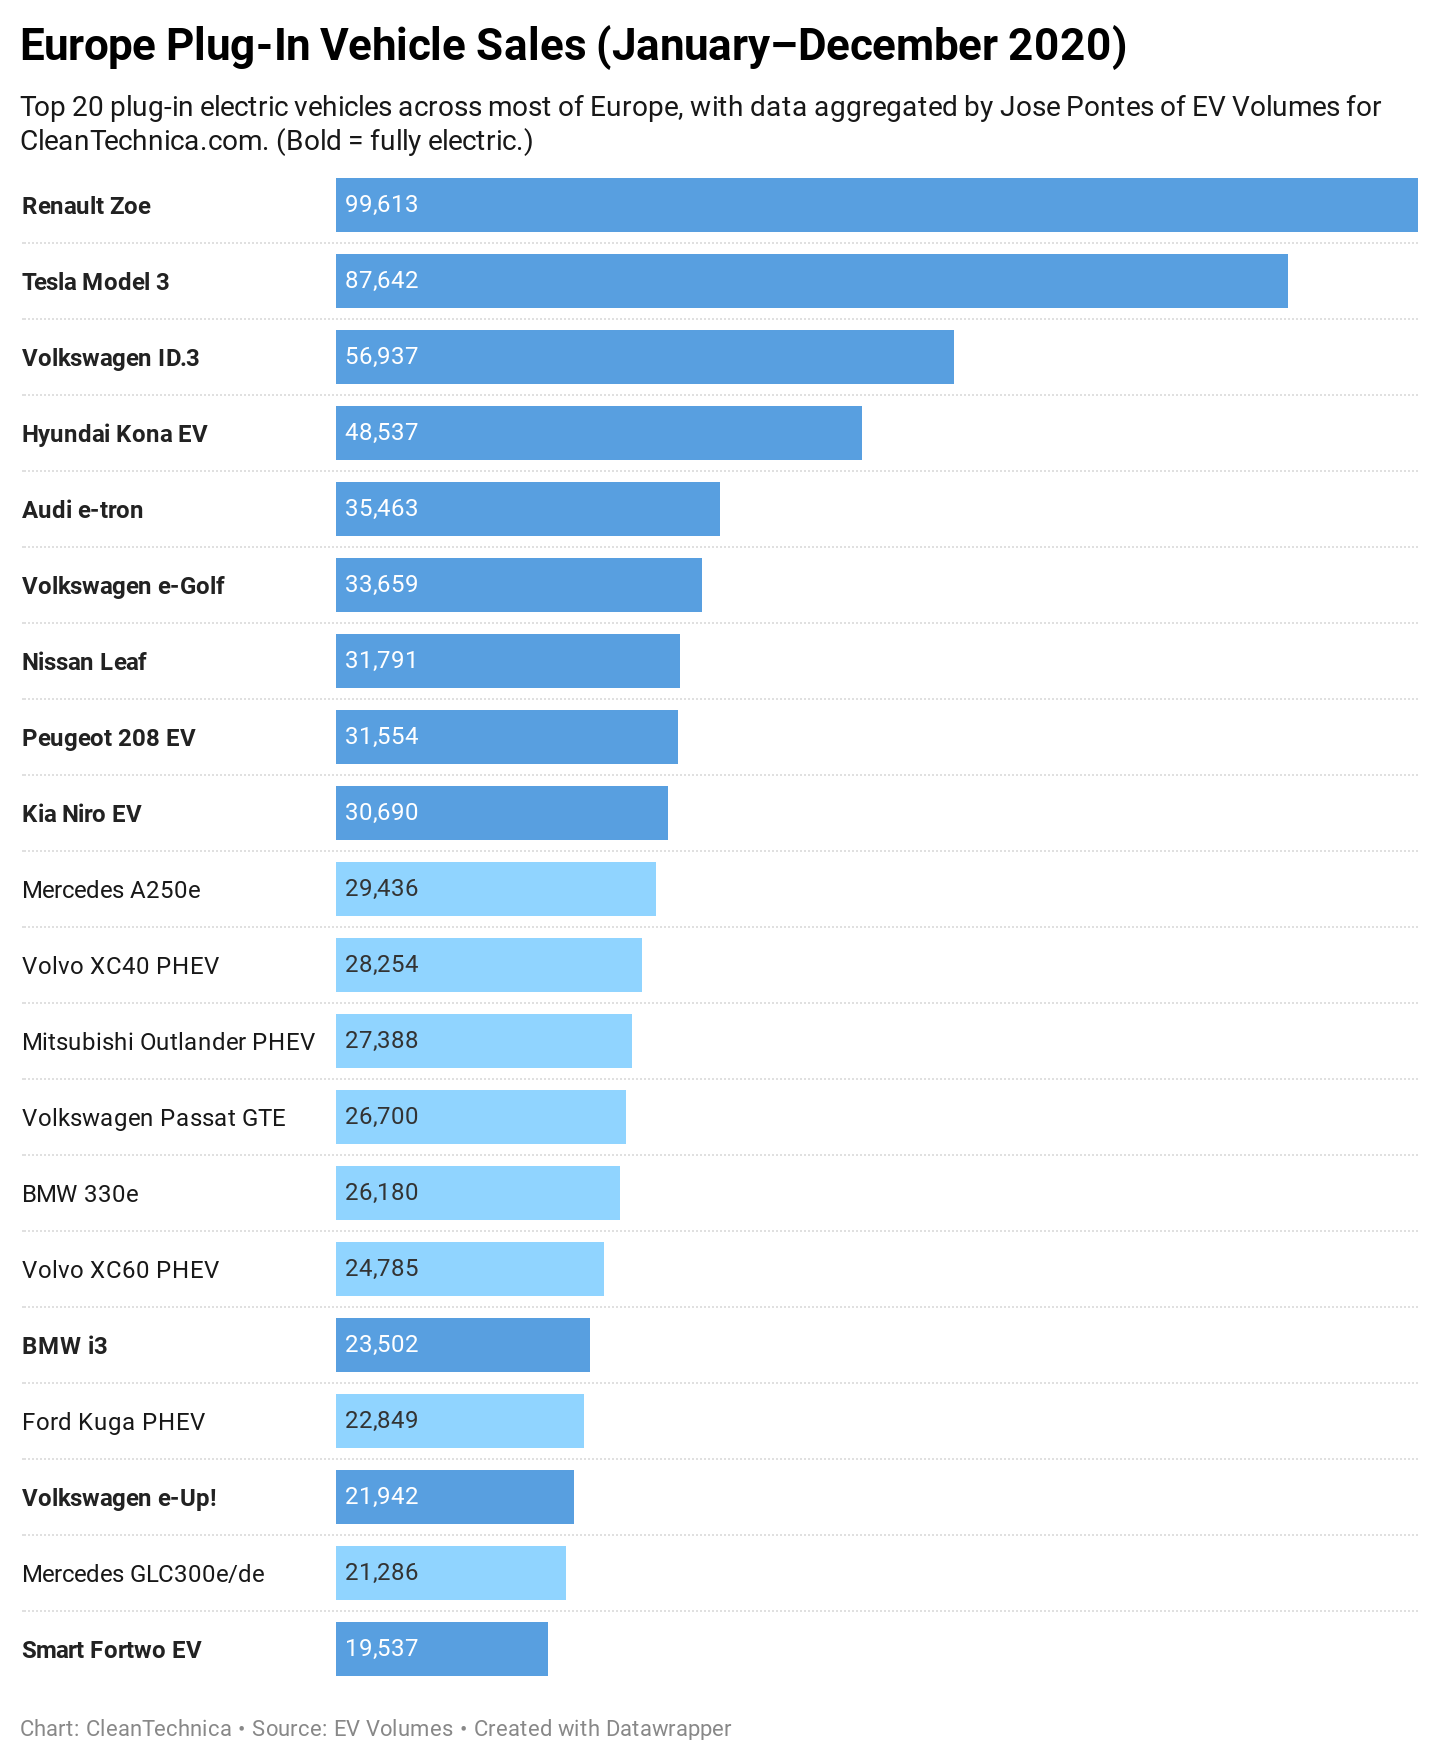
- Europe EV sales by model in 2020.
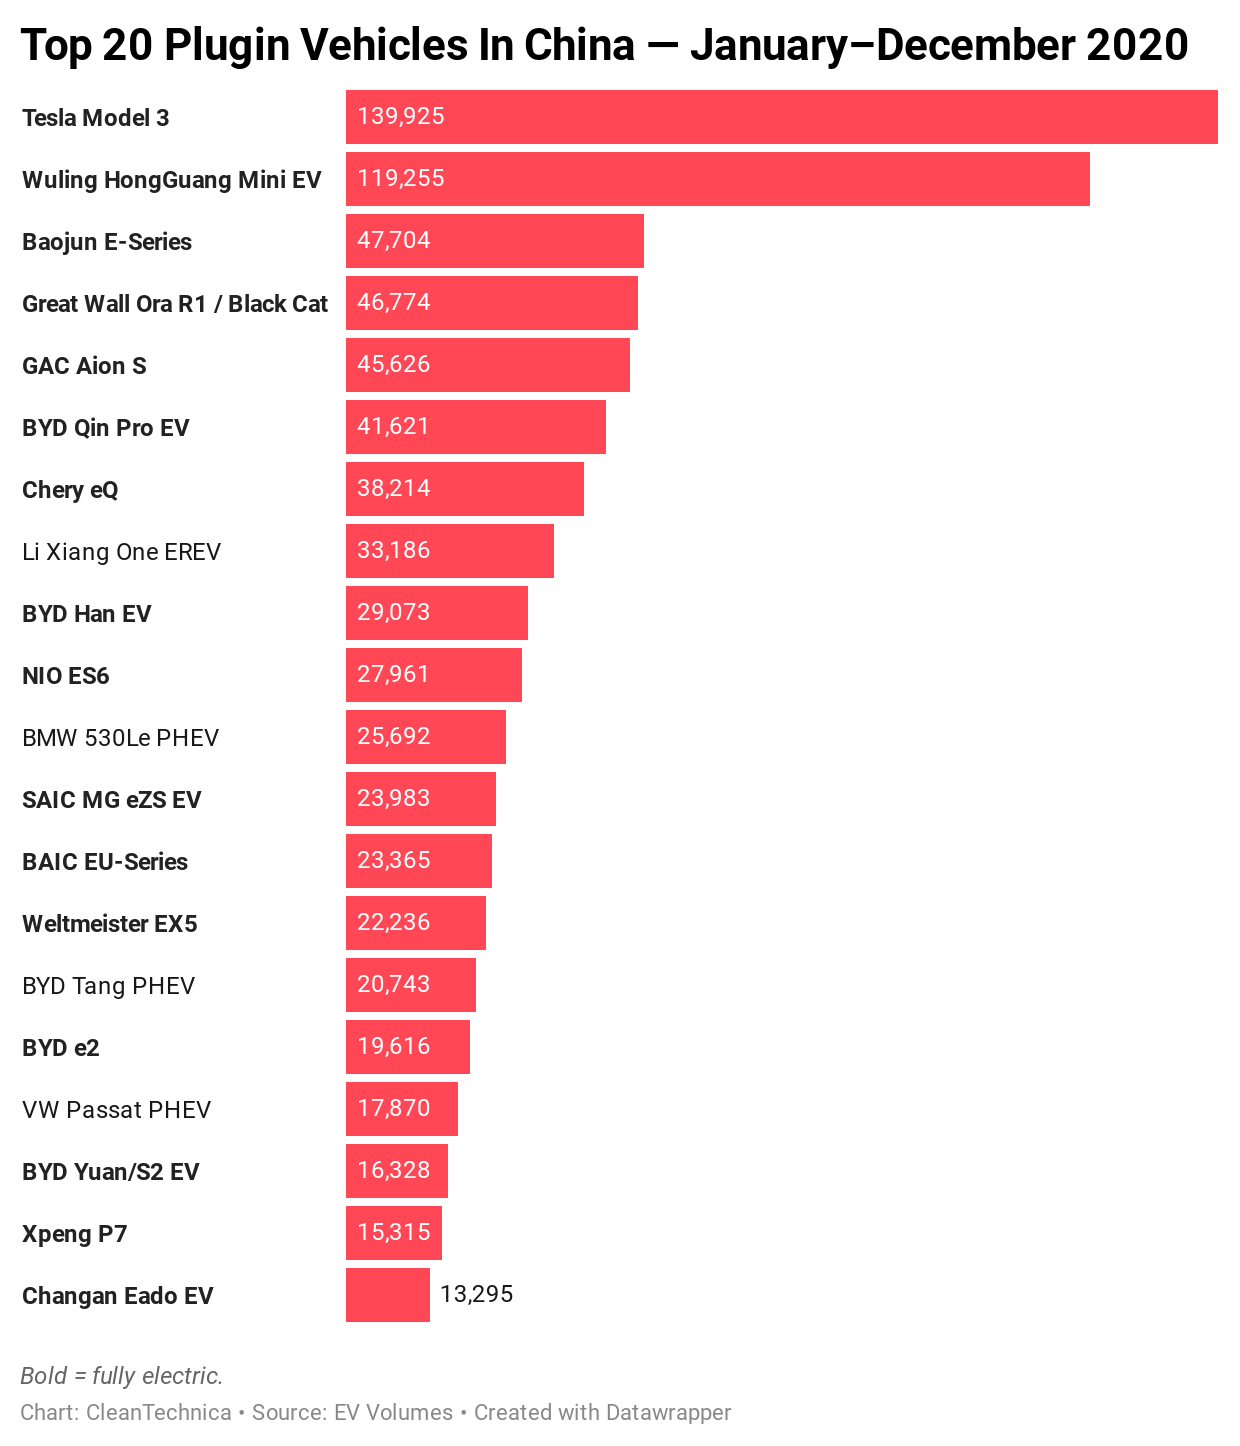
- China EV sales by model in 2020.
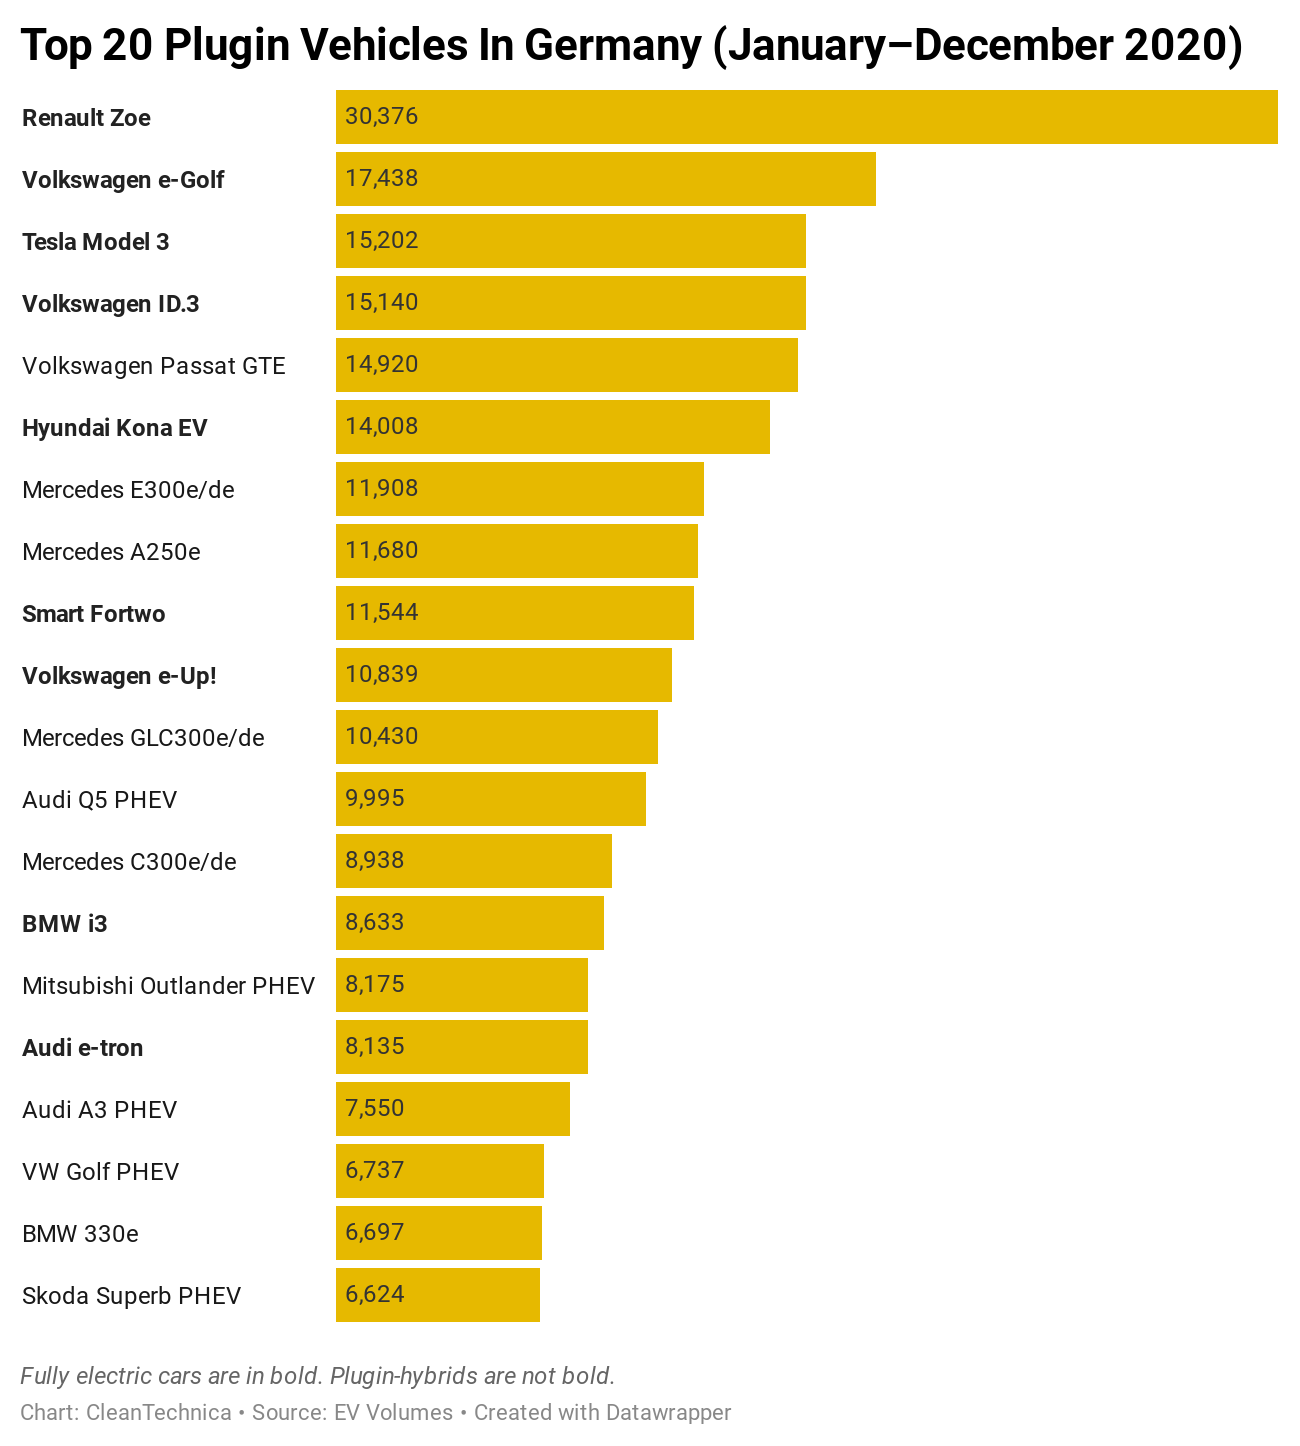
- Germany EV sales by model in 2020.
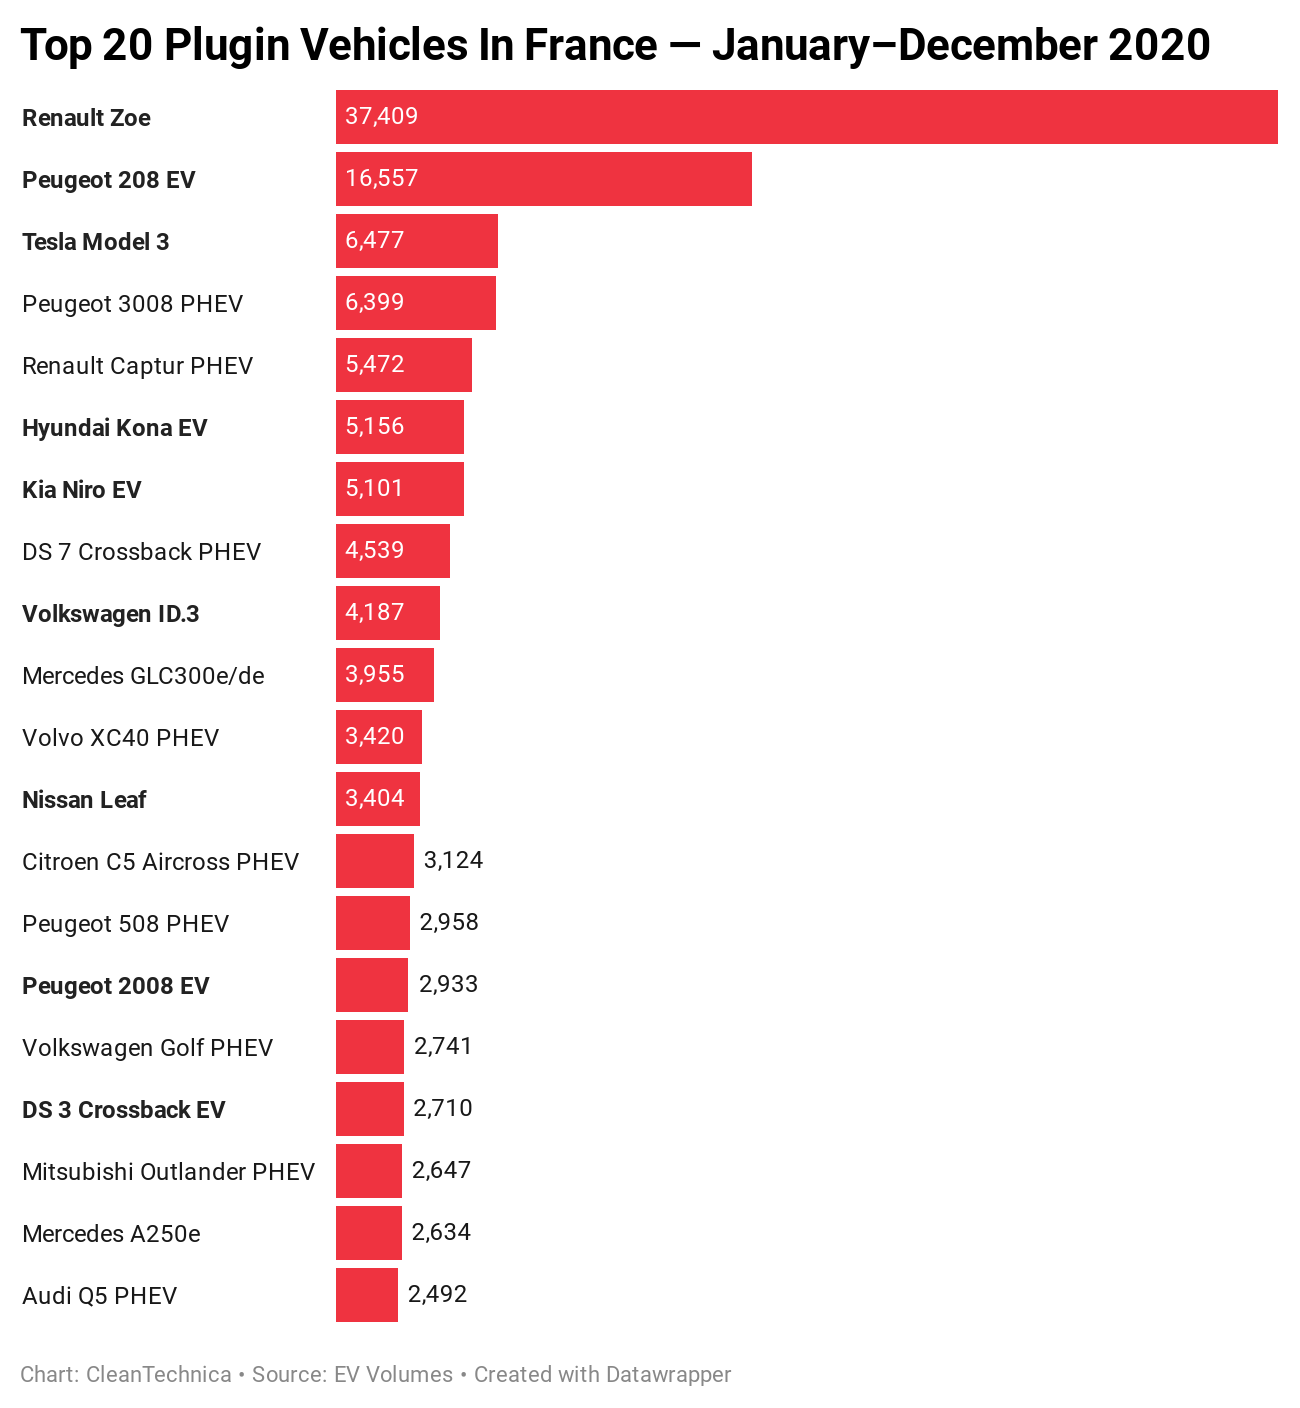
- France EV sales by model in 2020.
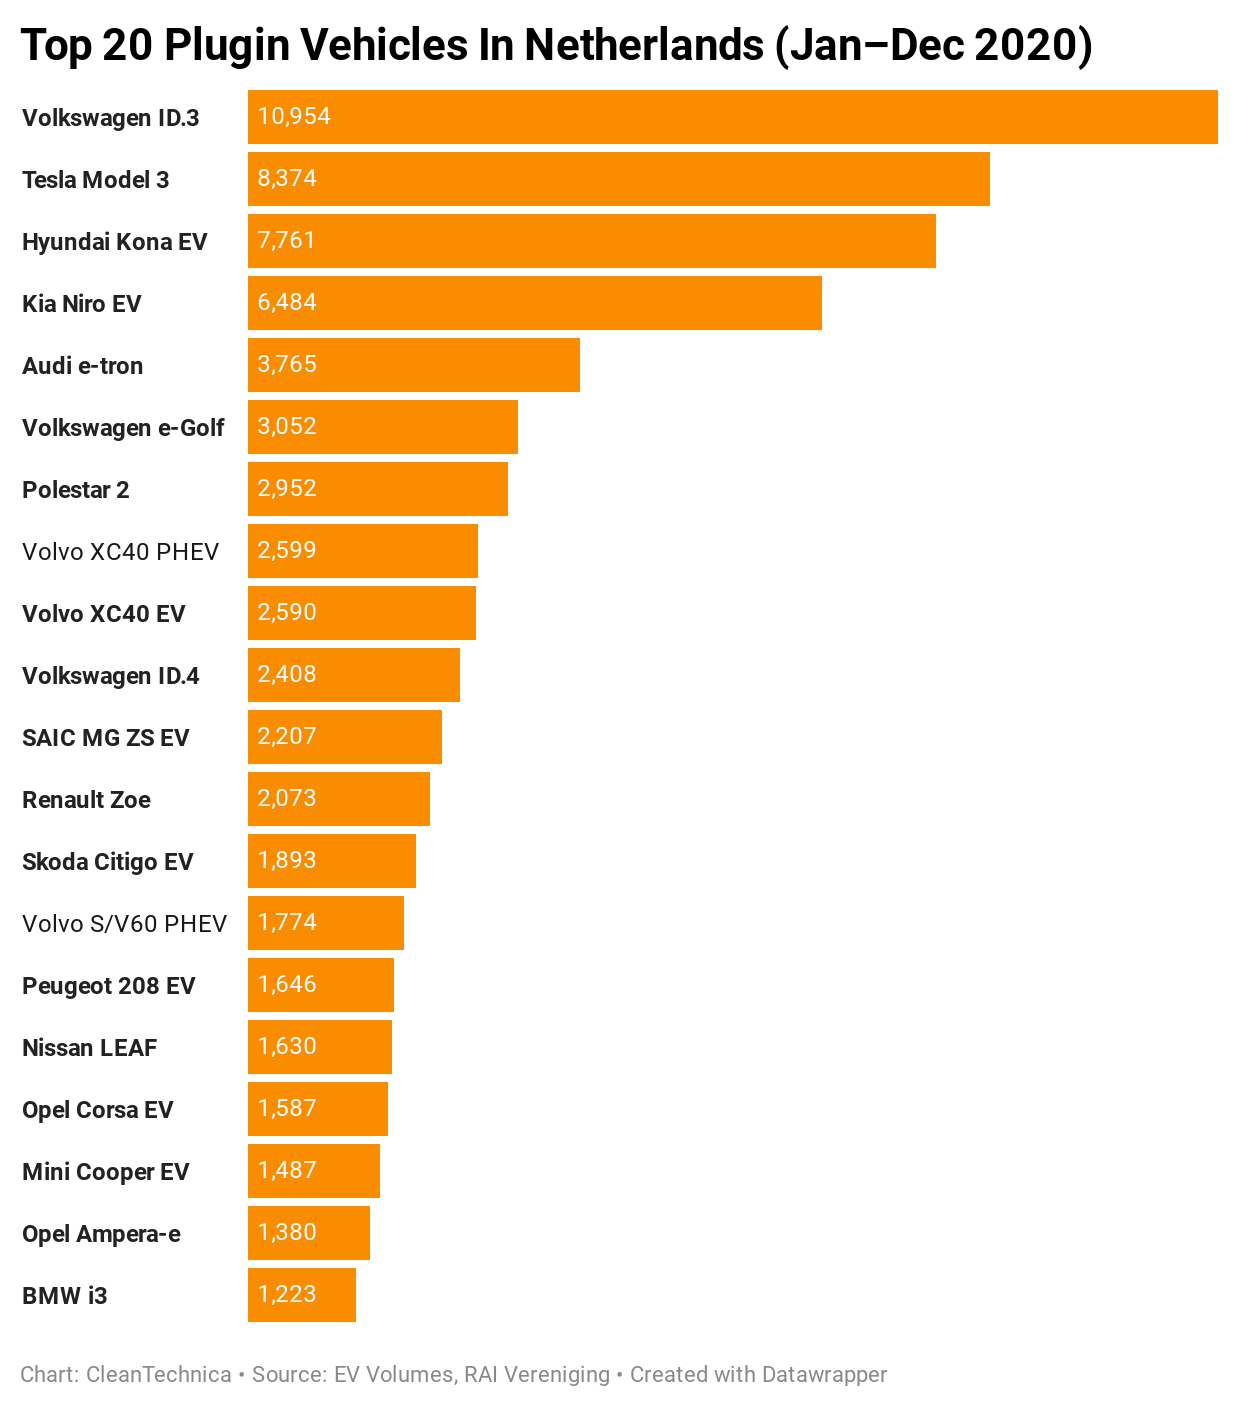
- Netherlands EV sales by model in 2020.
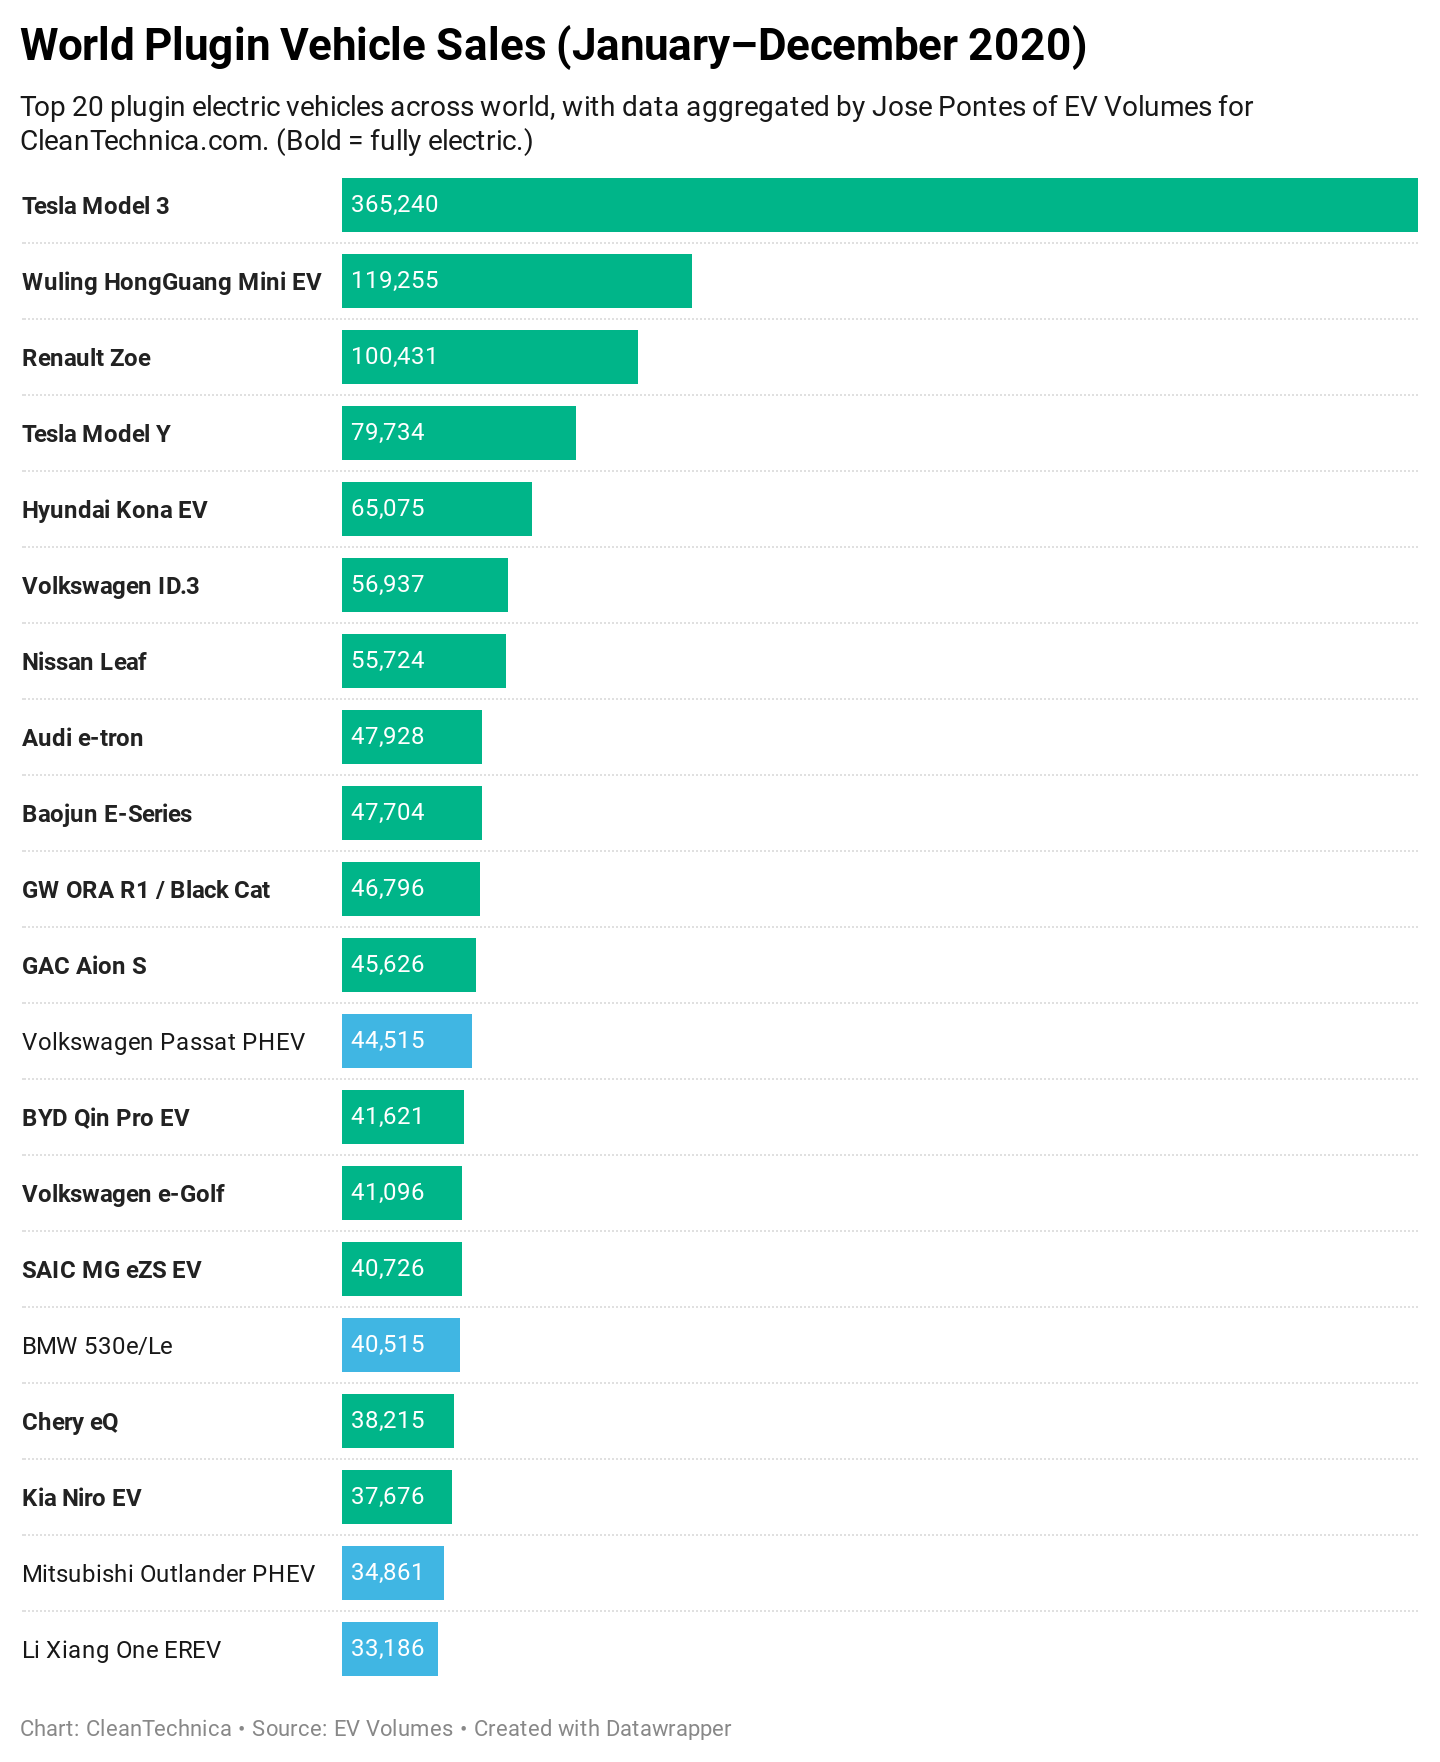
- Global EV sales by model in 2020.
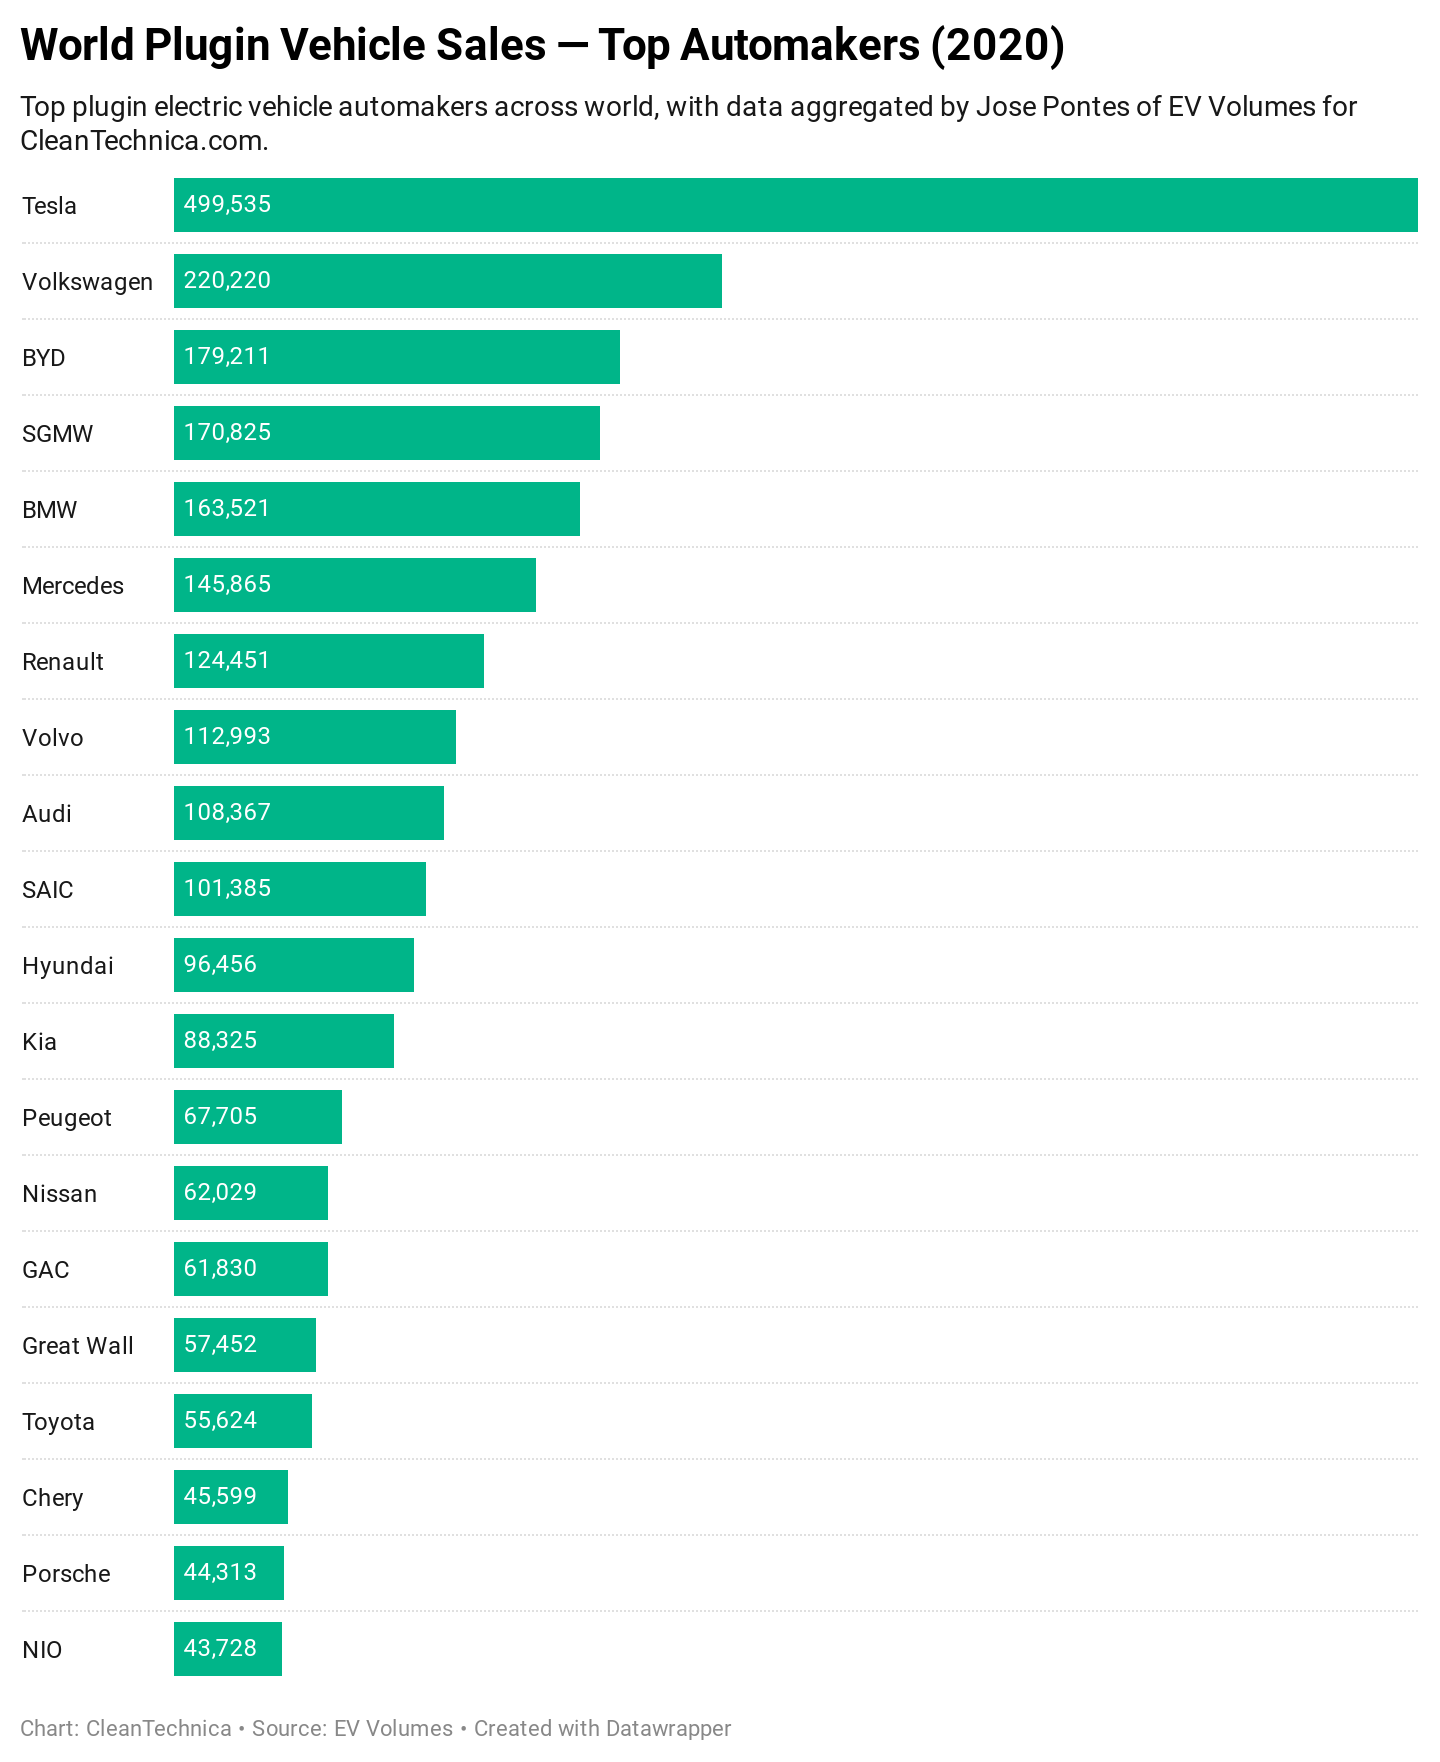
- Global EV sales by manufacturer in 2020.
Any other favorites you’d like to see on here?